The WEIBULL Dr.
Professional Reliability Analysis Routines and Reports
This program was created by research, design, test, reliability, and processing engineers for use by research, design, test, reliability, and processing engineers.
The latest program upload is as of July 6, 2022. It can be downloaded now as an upgrade to licensed programs. If not licensed, it becomes the trial version. The trial version is a fully armed and completely functional program. However, it has a 45 day time limit. If you believe you have a legitimate need for more trial time, give us a call. You can then re-download the latest version and we'll can send you a trial extension code by e-mail. This is the only site where you can download a legitimate copy of Weibull-DR. In addition, these routines that are truly unique and original are copyrighted. Questions? Call (763) 208-8259 or (763) 242-7721. Email us at jmb@applicationsresearch.com.
We've reviewed the websites of some our most significant competitors. It appears as though a number of the most useful bells and whistles for which they charge extra, are already included in Weibull-DR as integrated components of our standard package. In addition, we are positioning our program as a much more practical, most definitely easier to learn and use, alternative to our most significant competitor's flagship program. The reason for this is because we became convinced our competition tends to make this subject appear to be much more complicated than it really is. We believe you will be pleased.
We'd like to thank Dr. Edgar Bradley, Pr.Eng, MSc, of Bradley C&E and author of the book "Reliability Engineering: A Life Cycle Approach" for his multiple useful suggestions and encouragement in this effort. Edgar's book is available at CRC Press. In addition, Mr. James McLinn, ASQ, CRE has been of immeasurable help in the early development years of this software.
by
Applications Research, Inc.
Go to Applications Research - Contact Us
CLICK THIS LINE TO DOWNLOAD WEIBULL-DR AS A 45-DAY DEMO OR TO UPGRADE A LICENSED INSTALLATION.
To order by credit card go to:
https://secure.softwarekey.com/solo/products/Cart.aspx?action=add&actiondata0=13075
If you're looking for meaningful results for anything from heart valves to jet aircraft, with report printouts in a form that is understandable to non-technical management and co-workers as well as technical professionals, we believe you've come to the right place. These procedures and routines are compatible with all serious major industry and military standards. Another very important point to note is that, especially when human life is involved, component failure prevention isn't enough. One must also deal with the consequence of the failure to make sure it is contained by backups. This is also referred to as designing in forgiveness should a component fail. This is almost more important than preventing failure of a finite-life component.
 Why Weibull? This program gives you
a choice between multiple distributions. However, the Weibull distribution is
unique in that its density curve is fitted to the data, as opposed to fitting
data to a curve. In other words, the Weibull routine reveals, rather than
masks, the correct shape of the data's density curve.
Why Weibull? This program gives you
a choice between multiple distributions. However, the Weibull distribution is
unique in that its density curve is fitted to the data, as opposed to fitting
data to a curve. In other words, the Weibull routine reveals, rather than
masks, the correct shape of the data's density curve.
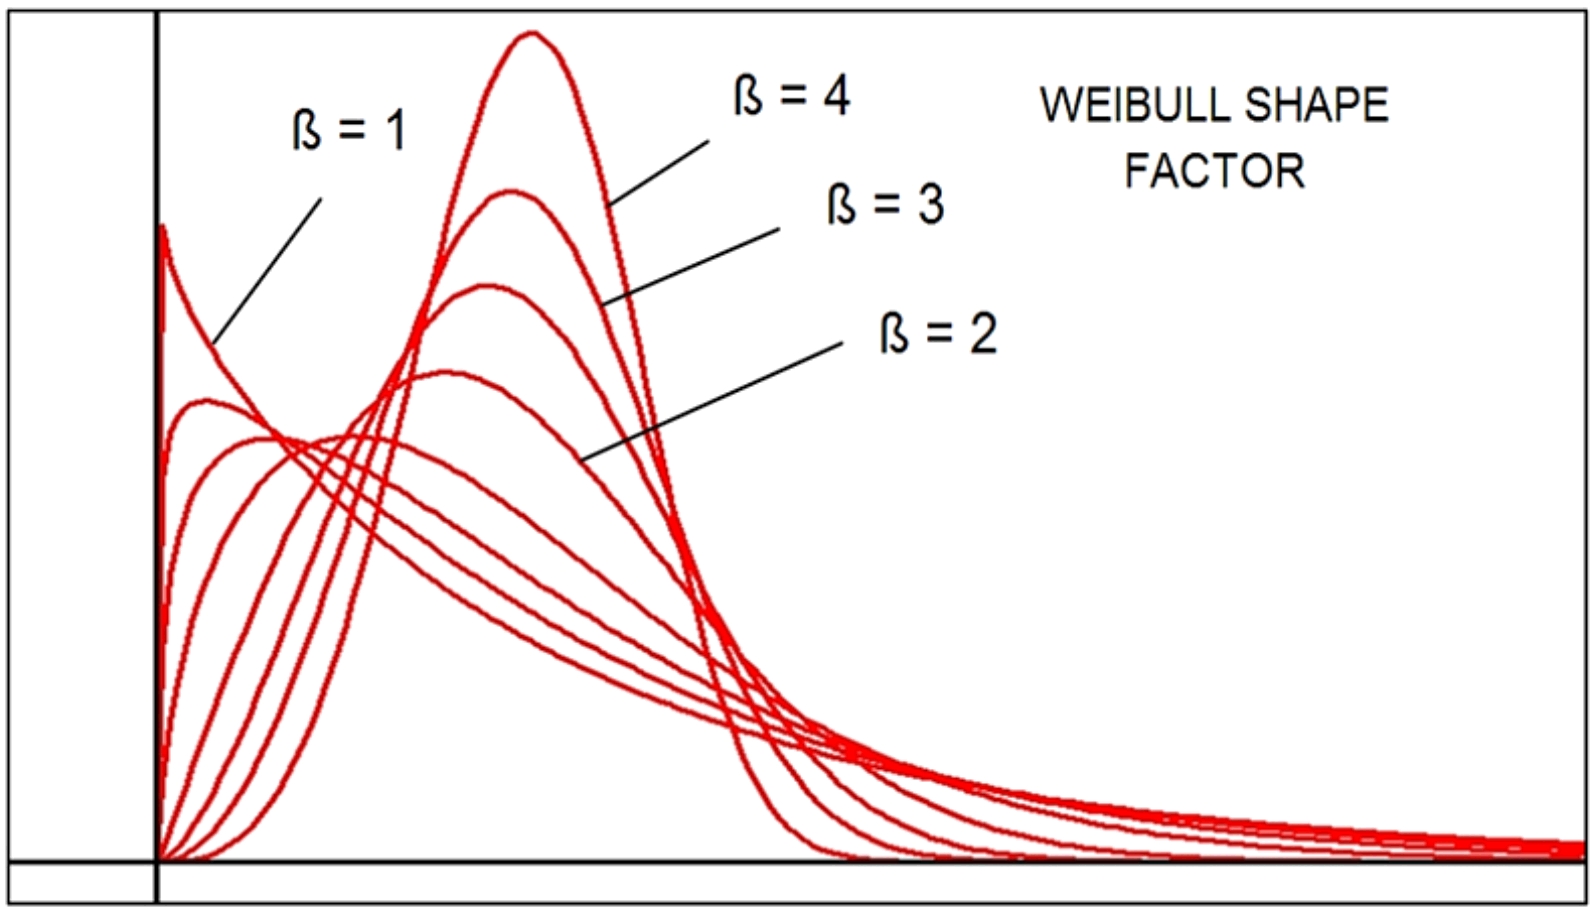
For example, a Weibull shape factor of 1.0 represents an exponential distribution. A shape factor of 2.0 is a Raleigh distribution, while a Weibull shape factor of about 3.0 or above represents an approximately normal distribution. Consequently, if data you've assumed to be distributed exponentially comes out with a Weibull shape factor of about 3.0, you'd best revisit your assumption.
In addition, use of any of the Weibull analysis routines to accomplish estimates of population characteristics, is simply a recognition of the fact that populations are rarely 100% normal, binomial, or exponential and so on. In other words, any reasonably complex piece of equipment, or even one of it's components, will never exhibit a failure distribution shape that exactly matches one of the traditional shapes. We are usually observing individual failures due to multiple causes. Also, deterioration in performance of one component, even though not having yet failed, can easily contribute to the failure of different component. For example, degeneration of automobile shock absorber performance, can cause premature tire failure. This is why the Weibull is used. The Weibull procedure represents your data as it is, regardless of the cause. In most instances, this is, by far, the most accurate and dependable representation of failure (or any occurrence) data.
Finally, it is important to understand that a Weibull routine is not a distribution in the same sense as a Normal, Log-normal, Raleigh, Exponential, or a host of other distributions. The Weibull is simply a data-fit routine. To reiterate - Dr. Waloddi Weibull's routine fits a curve to your data, as opposed to fitting your data to a curve. Because of this, the routine is almost invariably the best and most accurate way to evaluate test data for equipment reliability.
Weibull-DR was originally developed due to our recognition of the need for a stand-alone reliability software package that is responsive to the needs of the small to medium size design and/or manufacturing organization. Subsequently, even larger organizations have taken to using it because of its relative simplicity and the intuitive nature of the user interface. These routines for the various distributions Weibull, Normal, Lognormal, and Exponential, are quite straight forward and direct. The individual reports include all the pertinent data necessary to document your investigation. These reports are easily understandable to both non-technical co-workers and top management. Test data can be imported from other sources, such as Excel, via the standard Windows copy/paste routine. These stand-alone reports, or summaries, can be saved via the built-in PDF routines for e-mail or easy incorporation into other documents. As a side benefit, we've been told on multiple occasions that our program is an excellent learning tool for the Weibull, and other, distributions.
Early Failures Excessive or grouped early failures, i.e. the descending section of the so-called "bathtub" curve, are a clear indication of startup production problems. These need to be separated from the rest of the data points prior to evaluation of the design's actual life. This will be intuitively obvious to experienced design/manufacturing engineers. Later on, these points need to be separately examined to identify whether they are due to production deficiencies or simply a design too difficult or unforgiving to produce. Usually it's a combination of these two situations. These issues typically get ironed out as startup proceeds to fully developed production.
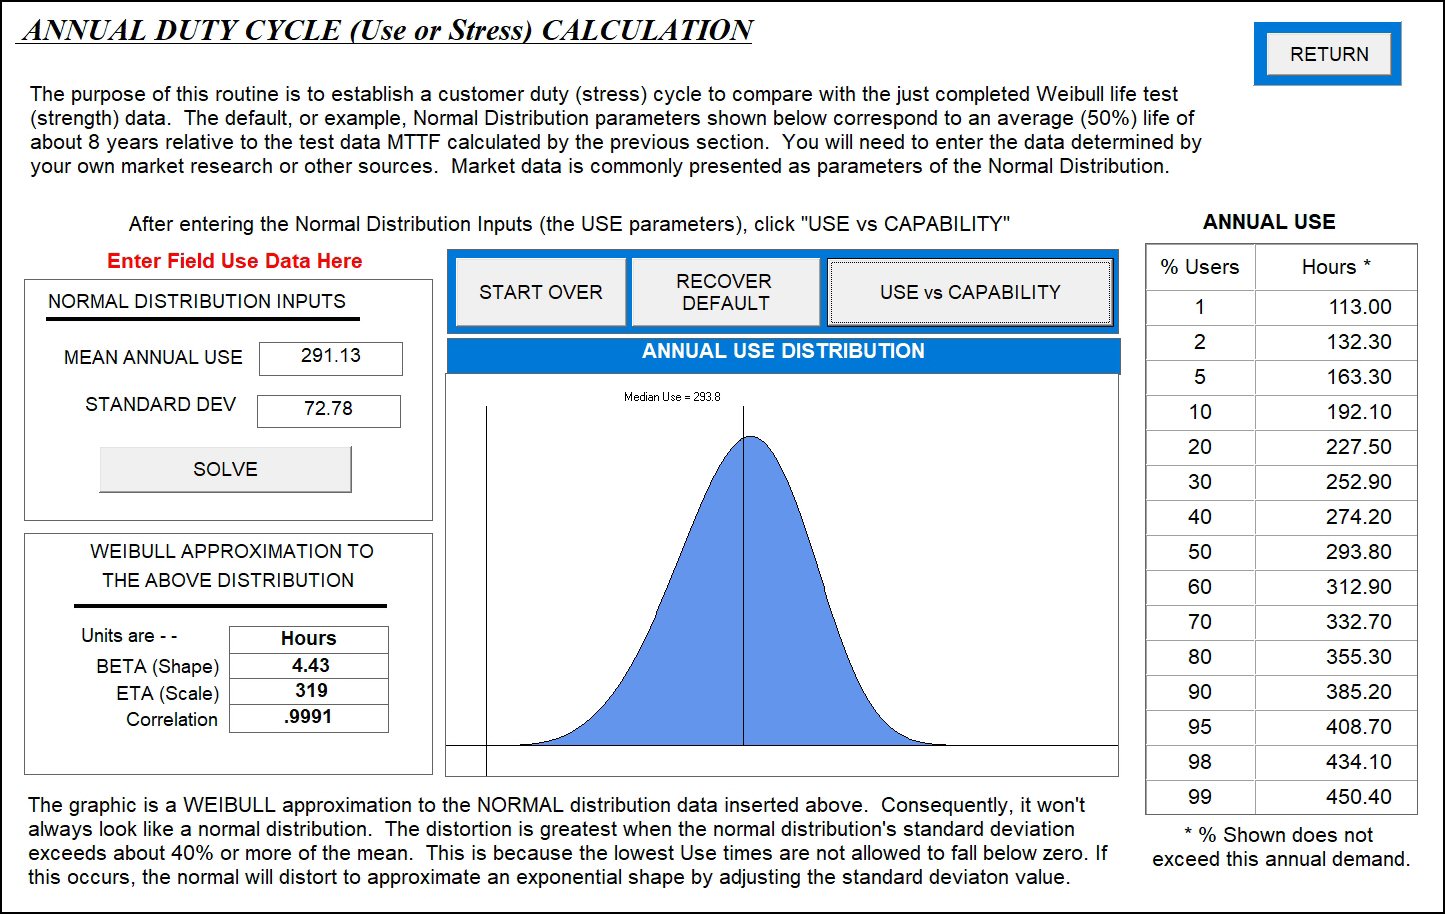
Procedures include both regression and maximum likelihood analysis of Weibull, Normal, Log-Normal, and Exponential distributions. You can switch back and forth between regression and MLE analysis with the click of a button while observing the change on the screen. In addition, we include zero-failure test design, we also provide blank Weibull paper graphs, and duty-cycle analyses. Weibull-DR uses a unique, simple and easily understandable routine for comparing engineering's lab or field test data with marketing's field use data. This is also referred to as comparing strength to stress.
Cost The cost for the system is $398 for each license. However, assuming an individual user needs an extra copy for a laptop - or whatever, each license is good for two downloads.
THIS PROGRAM INCLUDES MULTIPLE ROUTINES THAT COVER THOSE OFFERED BY LARGER, BETTER KNOWN RELIABILITY SOFTWARE ORGANIZATIONS, WITH THE MAJOR EXCEPTION THAT WE INCLUDE THEM IN A SINGLE PACKAGE.
In addition, we are willing and able to customize this or similar packages should you have unique requirements. Please call us at (763) 208-8259 or e-mail jmb@applicationsresearch.com if you wish to discuss customization.
To download (WEIBULL-DR DEMO) click here. The demo is a complete program except for a 45 day time limit on its operation.
In addition, the
following link is for a PDF of the four alternative forms of the Weibull
Distribution to use for hand calculations WEIBULL EQUATIONS
FINALLY - IMPORTANT AND UNIQUE FEATURES OF WEIBULL-DR OVER ITS MOST SIGNIFICANT COMPETITORS IN THIS FIELD
1.) Weibull-DR generates all values, with one or two keystrokes, for which the competitor's software requires 10 or 12 strokes.
2.) Our summaries are complete stand-alone reports, whereas the major competitor requires one to fish around and punch a half dozen (minimum) buttons.
3.) Confidence limits are posted both numerically and graphically on same page. The most common values are included.
4.) Confidence limits can be changed while observing graphical and numerical effect.
5.) The stand-alone reports, or summaries, can be posted immediately as PDF’s or can be easily incorporated into other documents or e-mails.
6.) Weibull 3rd parameter on/off toggle for instant view of graphical and numerical effect.
7.) Demo routine to explore the effect of Weibull’s shape and characteristic life factors.
8.) Uses default data and sample data sets to facilitate easy learning of routines.
9.) Includes excellent multiple (combined) mode analysis – including duty cycle matching or stress-strength calculations
10.) Far more complete, understandable, stress-strength routines with clarifying graphics.
11.) We believe you will find our copyrighted Zero Failure test design-documentation routine to be superior to anything you have yet worked with.
12.) Blank Weibull paper/graph setup/prints included as part of standard routine package.
To download (WEIBULL-DR DEMO) click here. The demo is a complete program except for a 45 day time limit on its operation.
NEW ROUTINES
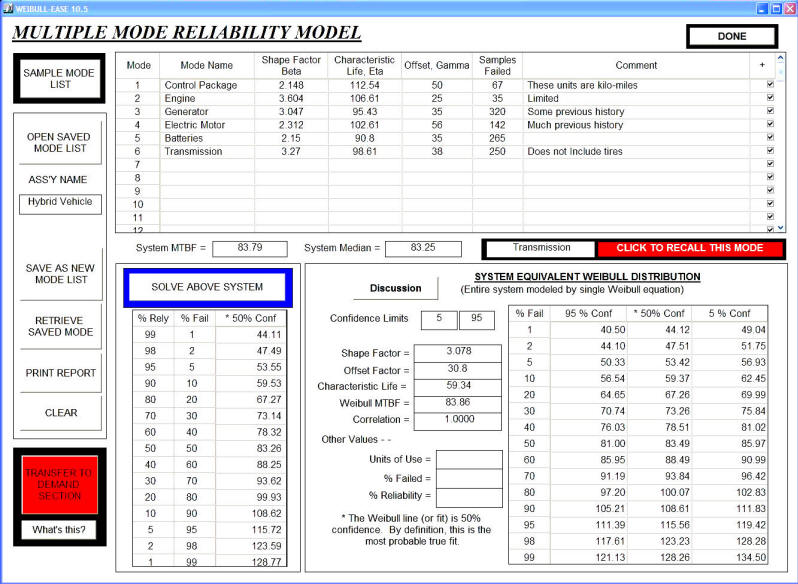
1.) System Simulation Reliability Model Most recently, we have developed and added a very clean, easy, system for analyzing multiple failure modes based upon each mode's Weibull distribution parameters. The individual modes' are combined to allow creation of a single Weibull equation to represent the entire system, which can then treated as if it were a single mode. We believe this copyrighted routine is the most simple, easy to understand, procedure on the market today. This routine can also serve as input for the Market Use Analysis comparison routine. All failure modes for a given system or machine can be saved together and recalled as a single set. This application can be of use to analyze fleets of vehicles or equipment throughout an organization's, or even a country's, structure. Future production's field reliability estimates is one obvious application. Analysis of rental car fleets is another. Large scale medical product studies is another. Military vehicle or equipment reliability inputs into computerized competition models is yet another. The built-in sample data routine shows you how this works.
2.) Duty Cycle or Customer Demand Analysis This data is typically provided by market research groups. This routine is to convert this market research use data in the form of quartiles by annual use, or as a normal distribution with standard deviation, into a form that can be compared to the product's capability. Here again, the analyses are based upon the Weibull relationships.
3.) Combined Distributions This routine compares the above multiple-mode Weibull capability analysis of a particular system, machine, or product (test data usually provided by engineers), and matches it against the Demand Analysis' Weibull estimate (typically provided by marketing groups) of the expected annual use of the same population of identical systems or products.
4.) Bearing Analysis Conversion of standard bearing load/life figures into Weibull reliability parameters. These can then be inserted directly into the Multiple Mode Analysis routine or used as is. Built-in sample data routine shows you how this works. We have also added a printout and PDF conversion for this section.
5.) PDF Files Weibull-DR now includes a PDF alternative with all the print routines. This improvement, along with others, has come about due to requests from multiple users of the program.
6.) Test Design and Planning Weibull-DR provides a practical, easy-to-use and understand, test design (including Zero Failure) calculation routine. If you download the demo and try it out, we are quite certain you will agree.
We believe we are now matching or exceeding the competitions' best, most useful routines - items for item, and at a much more reasonable cost. Our routines are those necessary to accomplishing the end of assisting you to put out a reliable product - - not simply a means of generating paper. These routines and printouts were created by, and are the result of solid, professional level input from practicing design, test, and reliability engineers from all over the country. While the numbers have always been accurate, we are always looking to significantly improve the presentations and reports. Consequently, if you do download and see where we can improve, please let us know. There is a strong possibility we will incorporate your suggestion within the next one or two sets of changes – especially if you are a customer. Keep in mind, upgrades are at no charge for 18 months.
In addition to the standard routines, Weibull-DR has a unique routine for calculating and accurately representing the reliability of a complete system by way of a single equation. It was originally developed by the author, while a senior level design/manufacturing engineer at Black & Decker, to satisfy the need for an accurate, easy to use, system to calculate reliability for medium to high volume products, before, during, and after production. Some incredibly accurate calculation vs. results on hedge trimmer data, convinced him that this was well worth pursuing. It is also used for integration of market research and field data with laboratory tests, warranty failure cost estimates, and future reliability. Those of you who use competitive programs would do well to download the demo and compare. We are quite confident that many of you who make a serious comparison will switch to Weibull-DR as your standard department software. When making accuracy comparisons, our regressions are based upon rank regression on X (i.e. RRX).
DOWNLOADS To download (WEIBULL-DR DEMO) click here. The demo is a complete program except that it has a 45 day time limit for its operation. If you need a little more time, please let us know and we'll figure out some way to accommodate you. If you have an earlier build version of Weibull-DR with the same name or number, you should not have to uninstall. It should be automatic. After 45 days, the key code is necessary to make the program permanent. While trying it out, you may have questions. If so, or if you simply need clarification on some part of the program, please give us a call at (763) 521-0217 and we will gladly walk you through it.
Purchase and insertion of the key code eliminates the above demo's 45 day time limit. Purchase also includes telephone or e-mail support and updates for eighteen months. The present price for the Weibull DR is $398 USD per license. Each license entitles the individual licensee to two downloads. The logic here is that many people have a desktop, plus a laptop that they work from. The unit price when purchasing multiple seats is less. To PURCHASE by CREDIT CARD, through PayPal, follow instructions included with the download package. If you prefer, we can also work through your company's purchase order. To arrange this, e-mail jmb@applicationsresearch.com or call us at (763) 208-8259 or (763) 242-7721. If, in the first 60 days after purchase, you discover an error you can't live with, give us a call and we will either correct the error or refund the purchase. An excellent reference for this program is the manual Practical Weibull Analysis, Fourth Edition, by James A. McLinn. This can be ordered directly through him by e-mail at jmrel2@aol.com .
If you have any problem with the download, please e-mail us call us at (763) 208-8259. In most cases we will correct the problem almost immediately.
This revision is as of July 6, 2022. If you've downloaded before then, you aren't quite current, so feel free to repeat the process as often as you wish. If you've downloaded much longer than a couple weeks back from the date shown, the improvements in function and related printouts may be dramatic. This is so much so, that even the graphics on this website have yet to catch up with the most recent features.
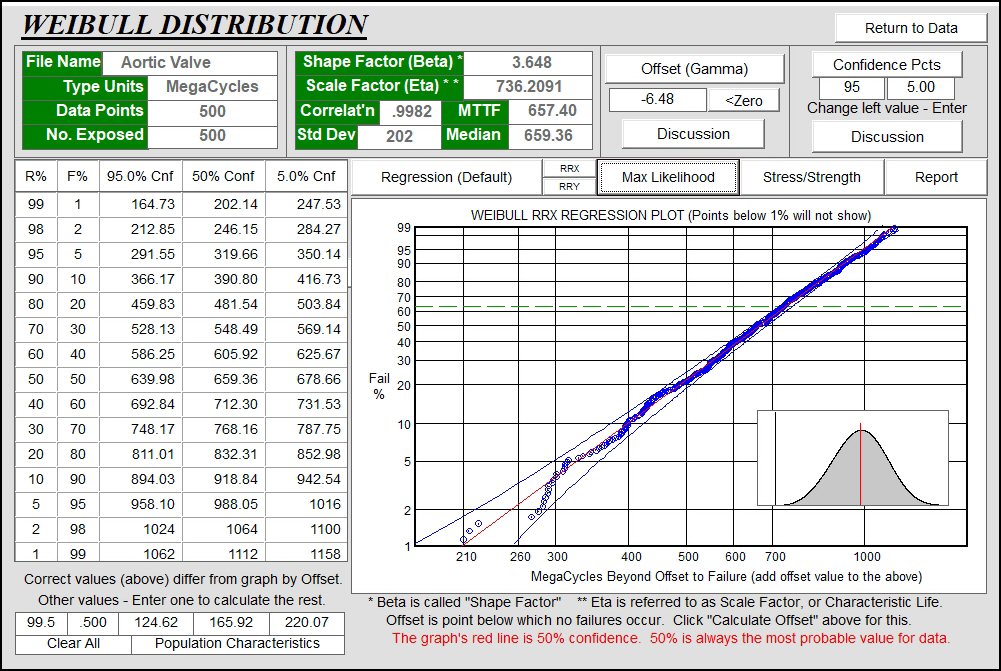
Weibull-Ease includes full three parameter analysis, confidence plots, suspended test compensation and automatic sort, plus grouped data insertion. Unique system of comparing market or field use data with test data to generate accurate prediction of field failure and warranty costs. It also includes routine to print scaled, labeled, Weibull paper. Also, we are not aware of any other software that prints out discrete reliability/failure values for the selected confidence limits. These are, at times, the most important figures sought by decision makers to facilitate their processes. The typical worksheet for the Weibull distribution is as shown below. Note we use rank regression on X as this is preferred by virtually all authorities on life testing statistics. There are other ways to generate the numbers, but rank regression emulates the way the equipment design process works - - i.e. best fit for the best available information. Wars have been won and lost on proper (and improper) application of this principle to equipment design.
Separate
routines include
MULTIPLE MODE ANALYSIS The software takes data generated from calculation of each individual mode and consolidates it into a single new set of Weibull distribution parameters. We are now able to represent the entire system with a single relationship. Note immediately below, how closely the System Equivalent Weibull Distribution matches the solved system points where the products of each reliability at each specified reliability level are individually calculated. This routine would be most useful for modeling large groups of relatively similar pieces of equipment, such as wind farms, oil wells, flotillas of ships, consumer products, buses, battle tanks, fighter jets, passenger planes, or fleets of over-the-road semi-trucks and trailers. For those working with MIL-HDBK 217 or similar standard routines, simply set all the Shape Factors to 1.0, offset values to zero, and the Characteristic Life values equal to the individual MTBF's. This routine goes a step further than almost all the rest, in that it also provides confidence limit estimates on each summary.
COMBINED DISTRIBUTIONS A final unique Weibull-DR feature is a routine to simplify and rationalize a series of tedious calculations to evaluate and quantify an essentially quite simple idea. That is, whenever the demand put upon an individual unit of the population being evaluated, exceeds its capability, it fails. In addition, Weibull-DR's capabilities enable you to accomplish the major critical functions of the more well known Weibull routines.
The ultimate goal of this effort is to match two Weibull distributions - -
1.) Unit Capability (or strength) Distribution
2.) Expected Customer Demand (or stress) Distribution
Capability or Strength
Demand or Stress
(Engineering
or Test data)
(Market Research Data)
to generate a third
distribution consisting of those units whose
individual
use has exceeded their respective capabilities (or life).
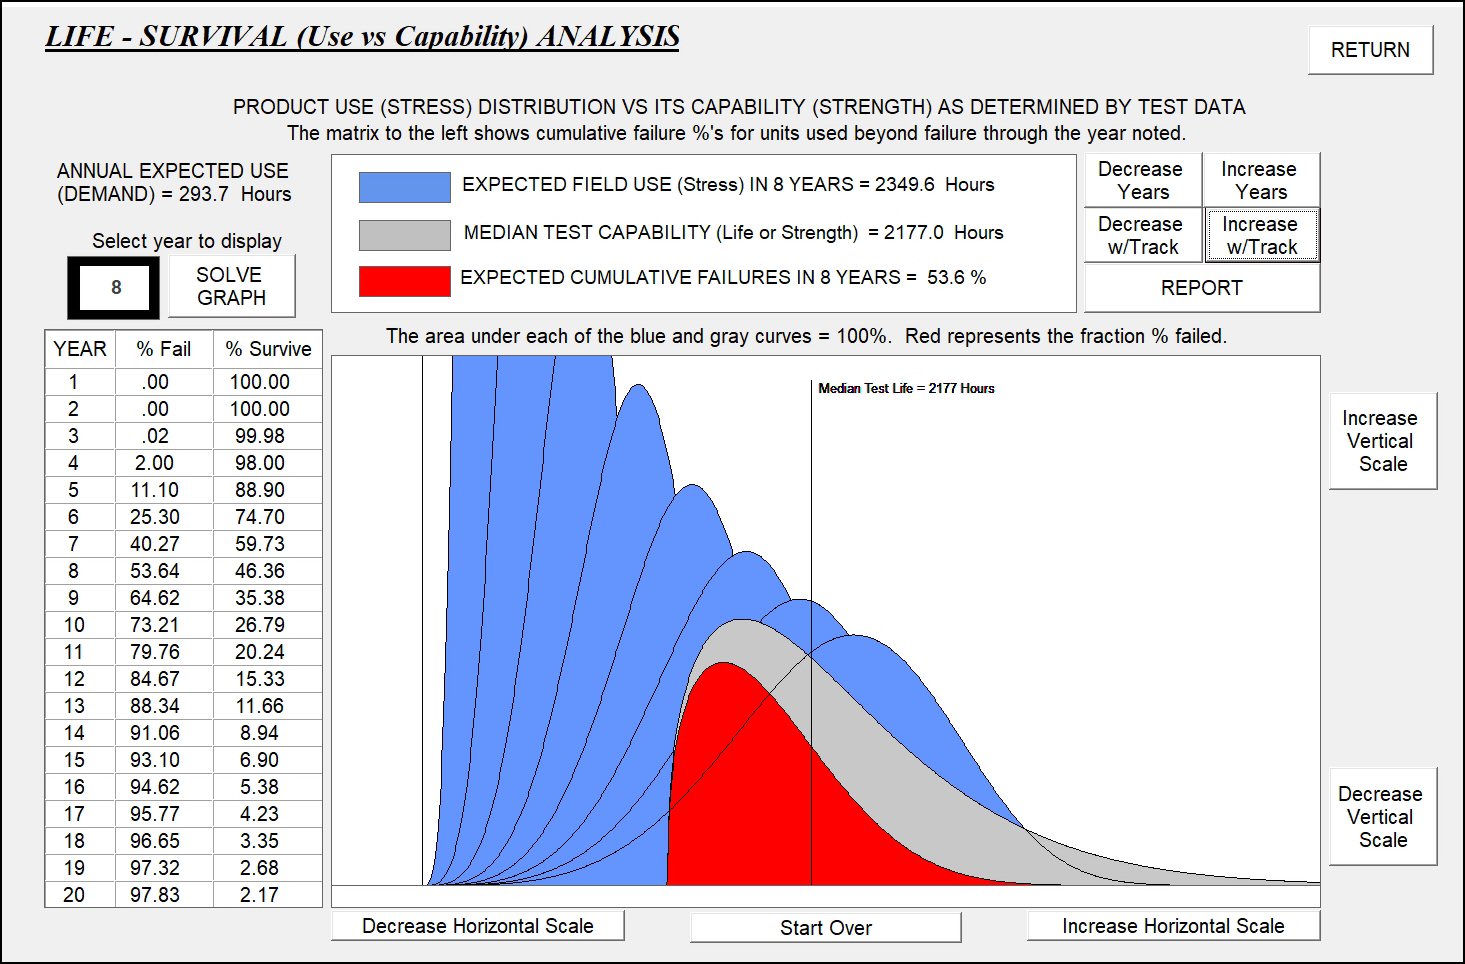
This method can be applied to most mechanical or electrical products, from light bulbs to lawn mowers, and especially, to life critical applications such as heart pumps or battle tanks. This routine also can be quite useful in helping to coordinate the marketing and engineering efforts in an organized, comprehensible, and workable manner. For example, a proper way to specify consumer product life can be by identifying two points on a maximum allowable failure schedule. This then requires identification of say, 1% failure in the first year and 25% failure in the fifth year. This is a figure which would normally be supplied by marketing and/or market research departments. This is also the type of input needed to define the Demand (or Stress) distribution. It is then compared with Capability data determined by the Engineering and Test Departments.
Finally, please note below that our printouts are complete stand-alone reports that include the shape of the distribution, plus the standard statistical parameters. They go a step further in that they also include the numerical values of the confidence limits at each selected reliability level. We believe this to be a unique feature that stands alone in this market.

The program generates the major standard distributions. These are Weibull, normal, log-normal, and exponential. They are all documented in a manner similar to that shown above and in such way as to allow convenient, clear, presentation to both technical and/or non-technical audience. We trust this system will work out well for your needs and we look forward to your feedback.
IMPORTANT NOTE If you experience any problem whatsoever with the download or the program, please call us right away. Most likely, we can straighten out the problem, or answer any question, in short order. Please don't hesitate to do this. You will only be doing us a favor and we will appreciate it.
Click here to download the DEMO PROGRAM. The demo is a fully armed and functionally complete program except for the 45 day time limit on its operation.
PRIVACY POLICY Applications Research, Inc. recognizes the importance of our customers’ trust. Keeping our customers’ personal information confidential is a top priority. This notice, which is required by state and federal law, explains our Privacy Policy.
1. We safeguard, according to strict standards of security and confidentiality, nonpublic, personal information our customers share with us. "Non-public, personal information", for example, would include such information as your name, address, phone etc. We maintain safeguards, physical and electronic, to protect that information. We conduct our business in a manner that keeps personal customer information secure. Credit card numbers are neither collected or kept by us. This is accomplished by linking you to our fully secured and authorized credit card processor, Software Key via PayPal.
2. We limit the collection and use of customer information to the minimum we require to deliver superior service and to administer our business. We collect personal information about customers strictly from your transactions with us. It goes no further than us.
3. It is our policy that only authorized employees, and staff who need to know your personal information will access and use it.
4. Whenever we retain other organizations to provide support services on behalf of Applications Research, Inc., we require them to protect customers’ personal information.
5. When necessary, we will review and revise our Privacy Policies to protect personal customer information.
WEIBULL-DR is copyrighted by, and the exclusive property of - -
Applications Research, Inc.
Visitors